Key performance indicators (KPIs) tell you whether the business is healthy, where it is heading, and what needs to be improved.
Most business owners I talk to don’t regularly track any metrics because they feel overwhelmed with choosing the right ones, or because they don’t know how to get the data.
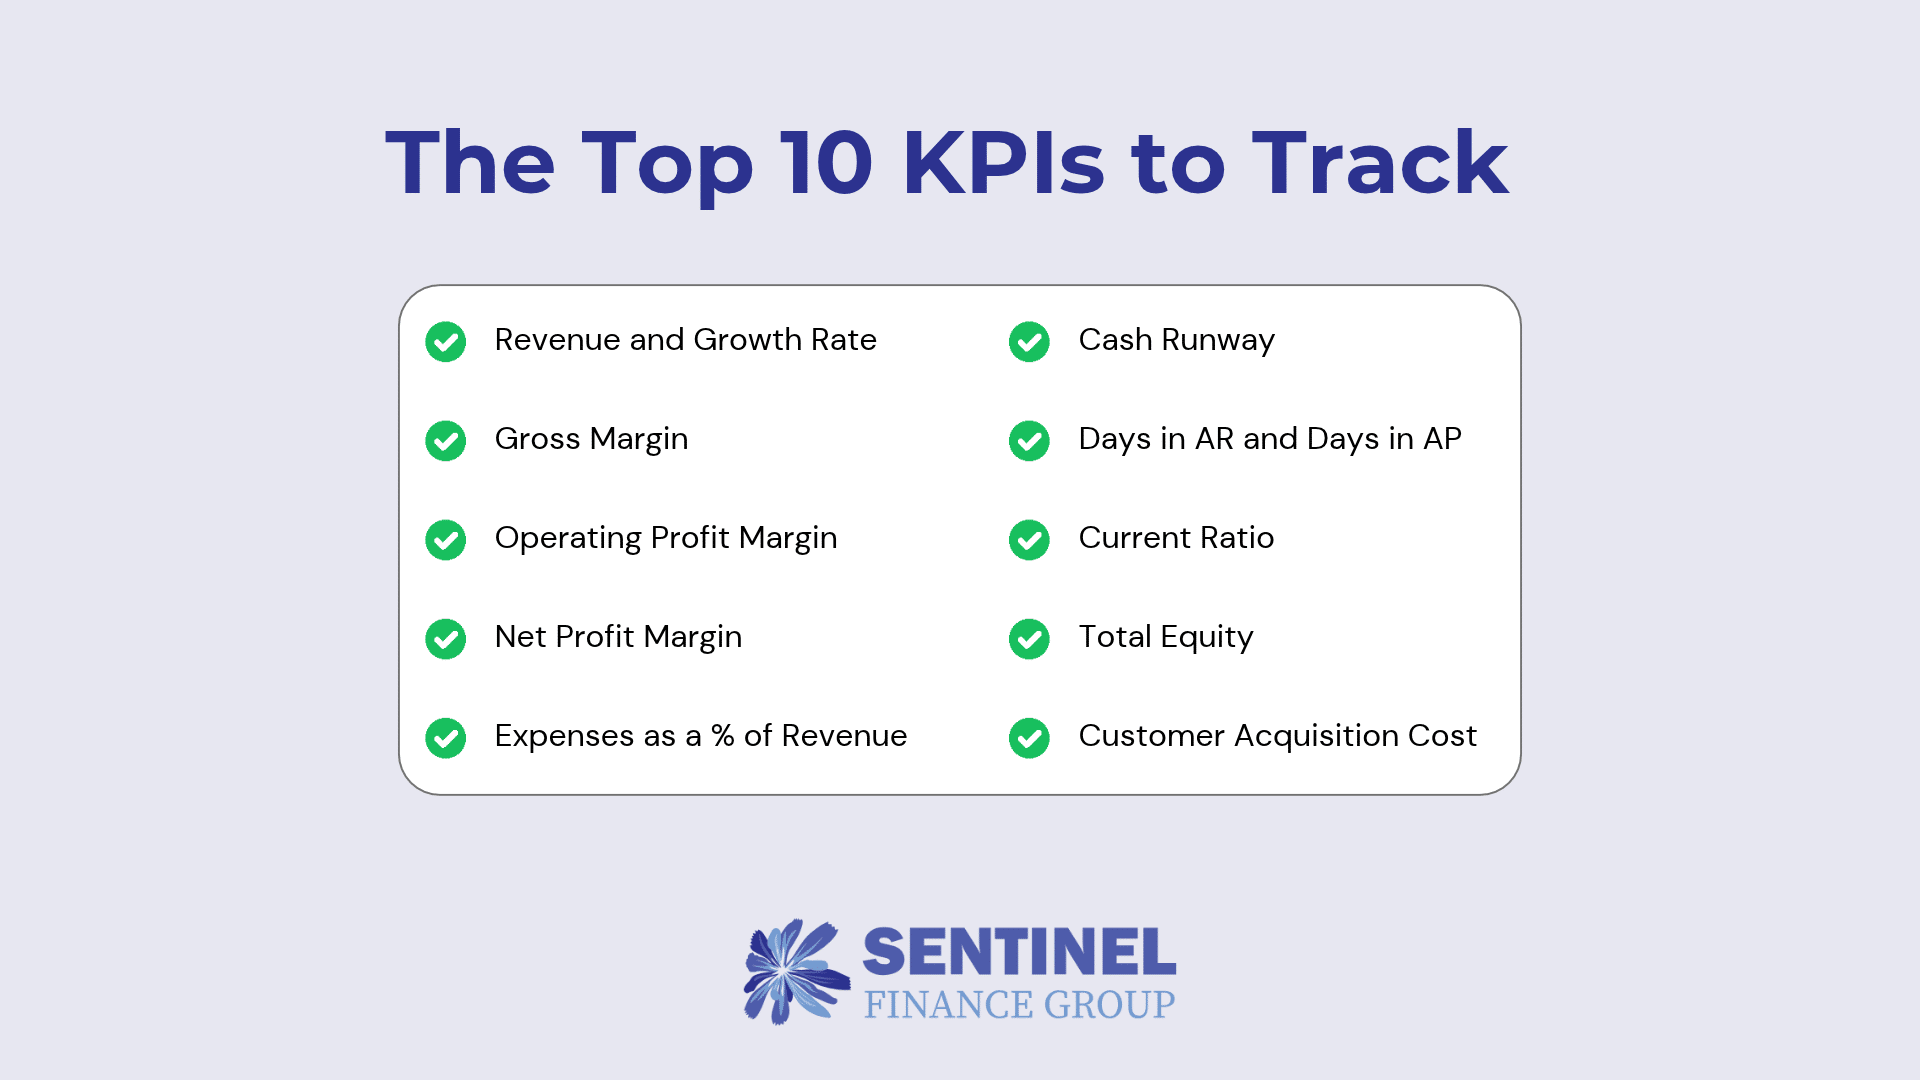
You don’t need 40 metrics. You need 10, reviewed with someone who knows what to do when one of them is off. Below are the 10 KPIs we see make the biggest difference for businesses between $1M and $50M in revenue, what each one tells you, and how to use them.
1. Top-Line Revenue and Revenue Growth Rate
Top-line revenue is the total amount your business brings in before any costs come out. Revenue growth rate compares that number to the same period a year earlier, which removes seasonality so you see the real trend. Track both monthly. Then read them alongside your other margins, because growth that comes from discounting or low-margin work can look good from a revenue perspective but bad from a net profit margin perspective.
2. Gross Margin
Gross margin is revenue minus the direct cost of delivering your product or service, shown as a percentage of revenue. It is the single best measure of whether your core offering makes money before overhead comes in. A business with a shrinking gross margin has a pricing, purchasing, or delivery problem, and growing revenue will only make that problem bigger. Track it overall and by product line, service, or customer so you know which have the biggest (and lowest) margin.
3. Operating Profit Margin
Operating profit margin is the percentage of revenue left after both direct costs and operating expenses like payroll, rent, software, and marketing. It excludes interest and taxes, so it shows how well the business itself performs regardless of how it is financed. When gross margin holds steady while operating margin falls, overhead is growing faster than the business. That is the sign to review your fixed costs.
4. Net Profit Margin
Net profit margin shows what percentage of every revenue dollar you keep after all expenses, including interest and taxes. Gross margin tells you if the offering works. Operating margin tells you if the business model works. Net margin tells you what the owners actually earn. A large gap between operating and net margin usually points to debt costs worth revisiting.
5. Expenses as a Percentage of Revenue
Tracking each major expense category as a percentage of revenue shows whether your costs are scaling appropriately or too quickly. Payroll, rent, marketing, and software are the usual categories to watch. A dollar figure going up is expected when you grow. A percentage going up means that cost is outpacing revenue, and that is the early warning you want. It also indicates things like when you can afford to hire and when you need to adjust pricing.
6. Cash Runway (Weeks of Cash on Hand)
Profit and cash are not the same thing. A business can be profitable and still run short of money. Cash runway tells you how long the business can cover its expenses with the cash it has today. Pair it with a rolling 13-week cash flow forecast and you will see a shortfall months ahead. That lead time allows you to make a plan instead of scrambling for a line of credit.
7. Days in Accounts Receivable and Days in Accounts Payable
Days in accounts receivable (AR), also called days sales outstanding, measures how long it takes on average to collect payment after a sale. A rising number usually points to ineffective invoicing habits, weak follow-up, or a few slow-paying customers.
Days in accounts payable (AP) measures how long you take on average to pay your vendors. Paying too fast drains cash you could have kept working. Paying too slow strains vendor relationships and can cost you early-payment discounts. Manage the two together. When customers take 60 days to pay you and you pay vendors in 20, your business is financing the difference, and that gap affects your cash balance.
8. Current Ratio
The current ratio is current assets divided by current liabilities. It answers a simple question: can the business cover what it owes over the next 12 months with what it has on hand or will collect in that time? A ratio below 1 means short-term obligations exceed short-term resources, and that is a warning sign. Lenders look at this number closely, so strengthening it before you apply for financing puts you in a better position.
9. Total Equity
Total equity is what your business owns minus what it owes. It is the clearest single measure of the value you have built on the balance sheet. Equity grows when the business earns profit and keeps it, and it shrinks when losses or owner distributions outpace earnings. Negative or shrinking equity is a red flag for lenders and buyers. Growing equity year over year is proof that the business is building lasting value.
10. Customer Acquisition Cost (CAC)
CAC is the total sales and marketing spend required to win one new customer. On its own, it tells you how efficient your growth engine is. Compared against the gross profit a customer generates over the life of the relationship, it tells you whether growth is worth paying for at all. If you are increasing marketing spend, this is the KPI that tells you whether the money is working.
How to Make Your KPIs Useful
A KPI only matters if it changes a decision. We’ve worked with clients who had dashboards full of metrics and still couldn’t say what to do differently next month. The problem was the lack of a process around it.
Start with clean, on-time books. Every KPI on this list depends on accurate accounting. If your books are wrong or the monthly close takes 6 weeks, your KPIs won’t mean anything.
Pick a short list. Choose the metrics that match your business model and ignore the rest. Too many KPIs means none of them get attention. Also, there are industry-specific KPIs that may be just as important as the ones listed above.
Set a target for each one. Decide what good looks like so you know when to act.
Review them on a schedule. Look at your KPIs every month, compare them to the prior month and the prior year, and leave every review with a decision and an owner.
What This Looks Like at Sentinel Finance Group
KPI reporting is built into how Sentinel Finance Group works with every client.
Live custom dashboards. We build each client a live dashboard with KPIs tailored to their business, so you can see your numbers in real time instead of waiting for a month-end report.
Full-service at every stage. Our accountant keeps the books clean, our controller closes the month on time and builds the KPI reporting, and our fractional CFO turns those numbers into decisions. It all happens under one roof.
One consistent team. The same people who know your business review your numbers every month, so nothing gets lost in a handoff.
Transparent pricing. You can see what it costs on our pricing page before you ever book a call.
No long-term contract and a free first month. You see clean reporting and real next steps before you commit to anything.
The right KPIs give you an early warning system for your business. Revenue and growth tell you where the business is heading. Your margins and expense ratios tell you if you’re making money and where it goes. Cash runway, days in AR and AP, and the current ratio tell you if you can keep operating comfortably. Total equity tells you how much value you have built, and CAC tells you what that growth costs. Track them monthly, act on what they show you, and you will make faster, better decisions with fewer surprises.
Schedule a conversation with Sentinel Finance Group.
Eric Reinacher is a fractional CFO who brings over a decade of financial leadership experience working with growing companies. He helps business owners improve financial visibility, make better decisions with their numbers, and build businesses that increase in value. LinkedIn
Sentinel Finance Group is a Kansas City-based fractional CFO firm providing financial leadership, controller, and accounting services to $1M-$50M businesses across the US.
FAQ
What are the most important KPIs for a small or mid-sized business?
The most important KPIs for a $1M to $50M business are revenue and revenue growth rate, gross margin, operating profit margin, net profit margin, expenses as a percentage of revenue, cash runway, days in AR and AP, current ratio, total equity, and customer acquisition cost. Together they cover growth, profitability, cash, and balance sheet strength.
How many KPIs should a company track?
Most companies should track about 10 core KPIs. That is enough to cover growth, profitability, cash, and the balance sheet without spreading attention so thin that nothing gets acted on.
How often should I review my KPIs?
Review your core KPIs every month as part of the monthly close. Cash metrics like cash runway and days in AR are worth checking weekly.
What is the difference between gross, operating, and net profit margin?
Gross margin measures profit after the direct costs of delivering your product or service. Operating profit margin also subtracts operating expenses like payroll and rent. Net profit margin subtracts every expense, including interest and taxes.
What is the difference between days in AR and days in AP?
Days in AR measures how long your customers take to pay you. Days in AP measures how long you take to pay your vendors. When days in AR is much higher than days in AP, your business is funding the gap out of its own cash.
What is a good current ratio?
A current ratio above 1 means your short-term assets cover your short-term liabilities. A ratio below 1 is a warning sign that the business could struggle to meet obligations due in the next 12 months.
Why should I track total equity?
Total equity shows the value you have built on the balance sheet. Growing equity means the business is retaining profit and building lasting value, and lenders and buyers look at it closely.
Who should be responsible for tracking KPIs?
A controller should produce accurate KPI reporting each month, and a CFO should interpret it and drive the decisions that follow. Many $1M to $50M businesses get both through a fractional CFO firm instead of hiring full-time.